Investment Advisory

Investment Advisory
A 6.1% fall in the Nifty 50 in a single month is the sort of number that sharpens every family-office conversation. IT stocks fell 11%. Foreign investors sold $4.1 billion of Indian equities. Within days the RBI had raised rates, Brent had crossed $100 again, and the rupee was hovering near 96 to the dollar.
It’s no surprise that one question is coming up in conversations with all investors: is the correction done, and is this the moment to put money to work?
The short answer
Partly. Price has corrected where foreigners were selling (large caps). Time and macro have not finished their work. And the part of the market where domestic money is most crowded (small caps) has not yet fallen to its average valuation.
That argues for deploying capital in tranches, anchored on large-cap and diversified equity: neither an all-clear nor a retreat. Whatever you decide, your asset allocation will determine the outcome far more than your entry date.
September in five numbers
| −6.1%
Nifty 50 in September; IT index −11% |
−$4.1bn
FII equity outflow in September |
+54 bps
US 10-yr yield to 5.28%; highest since 2007 |
+14.4%
Brent in September; ~$103 at month-end |
5.50%
RBI repo after 25 bps hike; stance now ‘calibrated tightening’ |
Indian equities have historically struggled whenever US interest rates or crude oil prices were high. What is new, is the combination. For most of 2000–2025, US rates were often elevated, but crude stayed below $100; when crude finally crossed $100 after the Global Financial Crisis, US rates had been cut to near zero. Today the US 10-year yield is 5.29%, the highest since July 2007, while Brent trades around $103–104.
For an economy that imports most of its crude, that is a textbook deficit problem: a weaker rupee (down roughly 8% year on year), portfolio outflows and market underperformance. Policy has stacked on top. The US Fed delivered its first hike since 2023 (to 3.75–4.00%) on 16 September. The RBI followed on 7 October with a 25-bps hike to 5.50% and a change of stance from neutral to ‘calibrated tightening’. India’s 10-year G-sec yield reached 7.29%, its highest since December 2023.
There is a narrative headwind too. With global capital piling into AI-linked businesses, India is seen as an ‘anti-AI trade’, and its IT-services bellwethers as potential casualties. Nifty IT fell 11.2% in September and is down 15.9% over a year; Edelweiss shows it is in an ongoing drawdown of about 42%, even though all six earlier declines of more than 20% eventually regained the prior high (median one-year return from the trough: 44%). The AI trade is the risk everyone knows about, nobody knows how it ends, and money that has gone abroad to chase it may not return in a hurry.
Valuation is where the case for investing is strongest, and where it needs the most careful reading, because India now has three different markets under one banner.
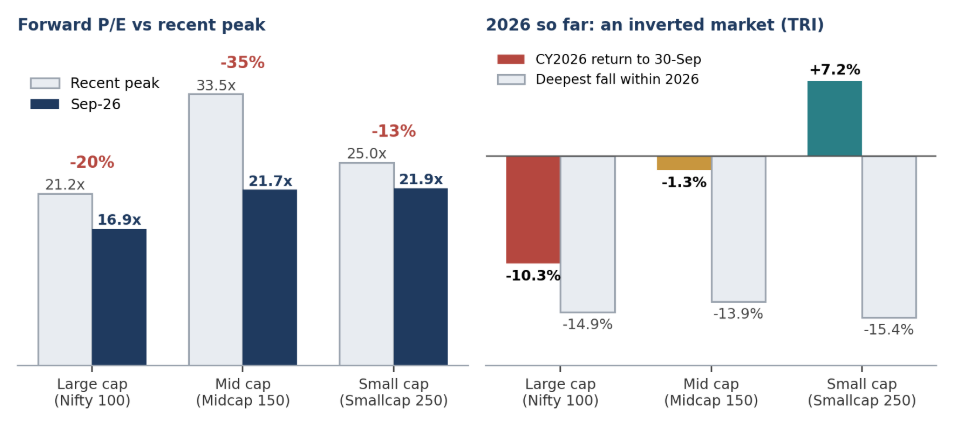
Put differently: the part of the market that foreigners own is priced for a downturn; the part that domestic SIPs own is priced for the flows to continue. And cheap is not the same as a floor. Valuation tells you what you pay for earnings. It does not tell you when the market will agree.
The Nifty fell for seven straight weeks (7 August to 25 September), roughly 6% cumulatively. The headline is encouraging: in all seven episodes with a full year of data, the Nifty was higher twelve months later, by an average of 33.4%.
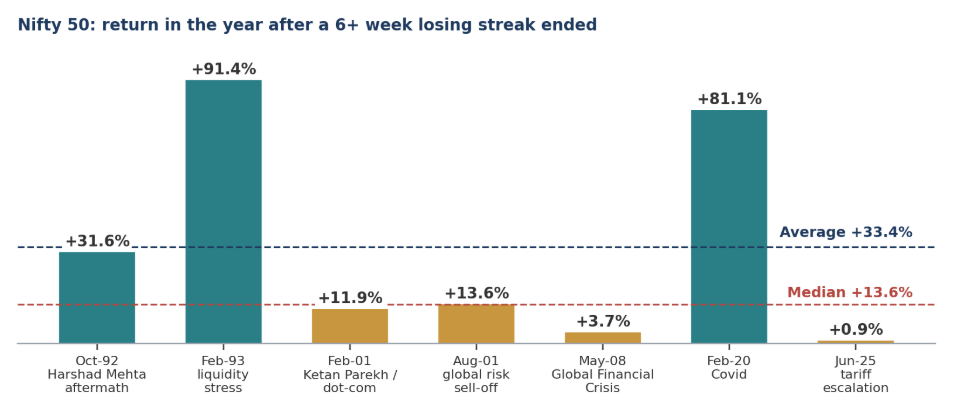
A statistic worth reading twice
Seven observations are not a law. The average is lifted by two violent rebounds (1993: +91%, 2020: +81%). The median is +13.6%, and two of the seven episodes (2008 and 2025) were up less than 4%.
Shorter horizons are less kind. Six months after the streak ended, only four of seven were positive; the 2008 episode was down 22% because the streak ended mid-crisis.
History also says mid and small caps beat large caps at six months in seven of those eight episodes. But by three years small caps beat large caps in only three of seven, and today small caps begin above, not below, their average valuation. We would not treat that pattern as an instruction. The practical lesson is about process rather than prediction: nobody rings a bell at the bottom, and waiting for one has its own cost.
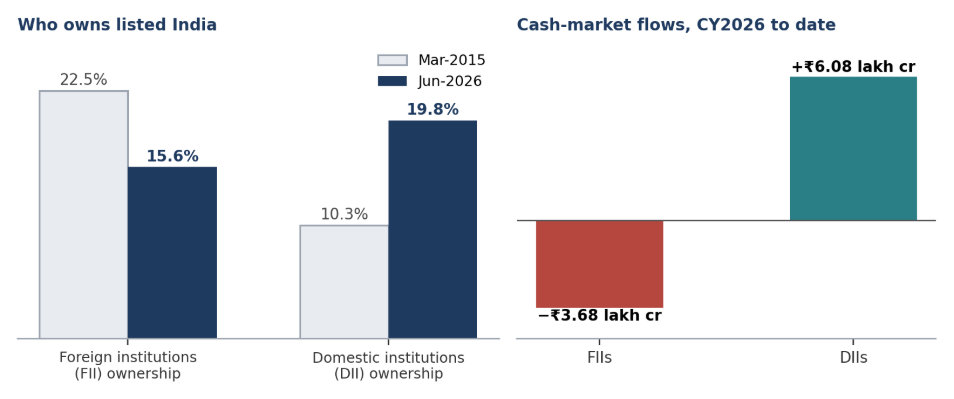
Stop reading the daily FII print. The better signal is domestic, namely whether mutual-fund money keeps flowing into small and mid-caps.
Earnings are the clock that matters most for mid- and small-cap valuations, and they show a mixed but improving picture.
What is working
What is flattering the numbers
The next two quarters of results will decide whether the disproportionate flows into small and mid-caps were justified. The calendar below shows what else lands in the same window.
| Catalyst | Date | Why it matters |
| September CPI | 12 Oct | Does inflation (4.82% in August) keep climbing? Shapes the next RBI move. |
| MPC minutes | 21 Oct | Colour on the ‘calibrated tightening’ path. |
| Q2 FY27 results | Oct–Nov | Margin and funding-cost test; the earnings case for SMID valuations. |
| September IIP | 28 Oct | Industrial momentum after August’s +8.0%. |
| ECB policy | 29 Oct | Global rates direction. |
| US midterm elections | 3 Nov | Trump’s pause on strikes against Iran runs only until then; US policy risk is in play. |
| Bank of England | 5 Nov | Global rates direction. |
| Next MPC meeting | Early Dec | Both Entrust and Edelweiss flag further hikes; short-duration paper is less sensitive. |
| Tariffs | Open | India–US talks at a ‘plateau’ (5 Oct); a new Act (signed 18 Sep) lets the US impose duties of up to 100% on top buyers of Russian crude, with a broad waiver. |
Dates per the Entrust note of 9 October; the first items will have passed by the time you read this, so check outcomes before acting.
| Clock | Status | Evidence | What could change it |
| Price: large caps | Largely done | Nifty 100 at 16.9x vs 21.2x peak (−20%); Sensex 16.9x vs 19.4x 10-yr average. | A 2020-style slide: the same support gave way to 12.3x. |
| Price: mid-caps | Partly done | Midcap 150 at 21.7x vs 33.5x peak; sits between average and −1 SD. | Earnings disappointment in Q2/Q3. |
| Price: small caps | Not yet | 21.9x, above long-term average, only ~13% off peak; +7.2% YTD. | Mutual fund flows into SMID turning to redemptions. |
| Time | Unresolved | Seven weekly losses; past ≥15% corrections took ~1 month to ~13 months to bottom. | Nobody knows; plan for either. |
| Liquidity | Mixed | DIIs absorbing FII selling (₹6.08 lakh cr vs −₹3.68 lakh cr); heavy IPO supply. | SIP flows slowing after a longer fall. |
| Earnings | Improving, unproven | Q1 FY27 Nifty earnings +13% vs +5%; Nifty 500 >15% compounders 48% → 67% (est.). | Q2 FY27 margins and funding costs. |
| Macro | Not yet | Brent >$100; US 10-yr 5.29%; RBI hiking; rupee ~96; monsoon 12.6% short. | Brent < ~$95, stable US yields or a tariff waiver. |
Read together, the scorecard says neither ‘all clear’ nor ‘abandon ship’. The correction has largely repriced the part of the market foreigners were selling. It has not yet earned the right to be called over in the part where domestic money is concentrated, and the macro triggers (oil, US yields, tariffs) are still unresolved. That is exactly the profile for which staged deployment was designed.
An illustrative three-tranche plan
Tranche A, now: large-cap core and large-cap-oriented diversified funds, about one-third of intended equity deployment. Rationale: valuations at or below average make this the lowest-regret entry.
Tranche B, time-based: spread across the next 4–8 weeks, past the 3 November US midterms and the Q2 results window, so no single event decides your entry.
Tranche C, trigger-based: add if Brent holds below about $95, US yields stabilise or a tariff waiver arrives; cut risk if the rupee breaks 99.8, Brent retests its highs, or mutual-fund flows into small and mid-caps turn to redemptions.
Mid and small caps go through staggered SIPs or STPs over a longer period, capped by the drawdown test in the next section. A price-based variant (splitting entries across progressively lower or confirming Nifty bands) is a fine discipline, but we would treat price levels as secondary to the triggers above.
Illustration for discussion, not a recommendation. Proportions should be calibrated to each family’s liquidity needs, horizon and tax position.
Asset allocation is the decision that matters most, and a rising market makes us forget it. September was a free stress test of whether yours is doing its job. Four pieces of evidence are worth keeping in view.
Diversifiers diversify over time, not every month. Over ten years, the Nifty 50’s correlation is about 0.01 with gold, 0.08 with Indian G-secs, 0.29 with the S&P 500 and −0.37 with USD/INR. The last figure implies that rupee weakness has tended to coincide with weaker Indian equities, so unhedged global assets have acted as a partial offset. Yet gold fell 6.3% in dollar terms in September alongside equities. Correlation is a long-run average, not a monthly guarantee.
Size each sleeve for the fall it has delivered. In 2020 large, mid and small caps fell 37.9%, 38.5% and 43.5%; small caps lost 35.7% in 2018 and large caps 26.4% in 2011. If a 40% fall in your small-cap sleeve would force you to sell something else or change how you live, the sleeve is too big, whatever the entry price.
Look beyond the border, carefully. In dollar terms, the Sensex has compounded at −1.6% over three years and −1.1% over five (ranking 17th and 18th of 20 markets), and 6.1% over ten. Rolling five-year SIPs in India averaged 9.5% (range −1.3% to 16.9%) over October 2016–September 2026, against 12.6% (4.0% to 18.9%) for the S&P 500. For rupee-based families, a measured global allocation, within LRS limits and each family’s tax position, diversifies currency and the AI-linked sectors India does not offer. Past dollar returns are not a forecast, but concentration is a choice.
Income and real assets earn their place when inflation is the risk. InvITs and REITs fell only 0.36% in September, rose 3.3% over three months, must distribute at least 90% of net distributable cash flow, and typically yield 6–10% with CPI- or WPI-linked escalations. Private credit targeting 14–16% gross yields, typically senior-secured with 2–3x collateral, but with higher credit risk and 4–6 year lock-ins; Edelweiss notes AAA spreads have widened 10–20 bps in the 2–5 year segment. These are not free lunches: illiquidity, manager selection and credit risk are the price.
A layered structure keeps these roles distinct. This is a framework for structure, not a set of percentages:
| Layer | Role | Typical building blocks | Sizing question |
| 1. Liquidity and safety | Fund 2–3 years of obligations so risk assets never become forced sellers. | Short-duration and accrual strategies; 2–3 year segment. | How many years of outflows can you cover without selling equities? |
| 2. Equity core | Long-run compounding. | Large-cap and large-cap-oriented diversified funds; hybrids for built-in rebalancing. | Is the money genuinely a 7-year-plus allocation? |
| 3. Equity satellite | Selective growth. | Mid and small caps via staggered SIP/STP; earnings-backed names. | Could you hold through a 40% fall? |
| 4. Real assets and hedges | Inflation-linked cash flows; crisis ballast. | InvITs, REITs; gold. | Are distributions rising with inflation, and is the entry yield sensible? |
| 5. Global diversifiers | Currency and sector diversification. | Global equity and AI exposure through permitted routes (LRS, GIFT City feeders). | What currency mix do your liabilities need? |
| 6. Yield alternatives | Higher income, lower equity correlation. | Private credit; absolute-return strategies. | Can you accept 4–6 year lock-ins and credit risk? |
Four rules keep the structure honest. Write down target bands and rebalance when they are breached; use a correction to refill an under-weight equity band, not to exceed the plan. Separate money by time horizon, so that shorter-term needs never depend on equity prices. Stagger every entry into the volatile layers. And judge the portfolio, not the product: a fall in one sleeve is a question about the whole, not a verdict on that sleeve.
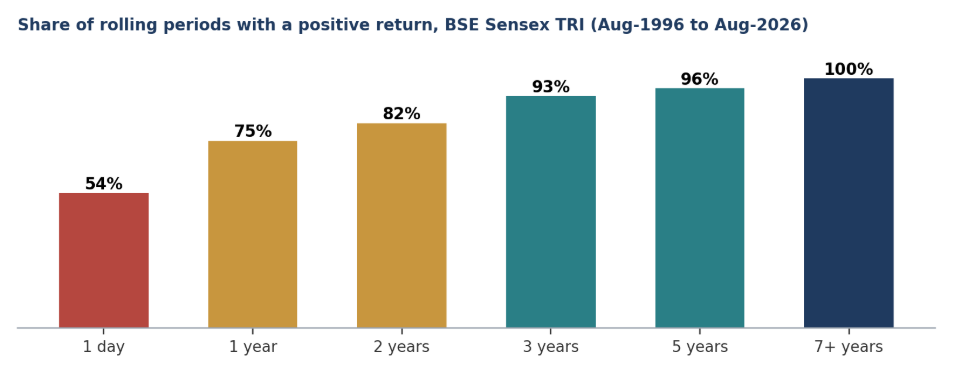
The chart is the case for separating money by horizon. Short-horizon outcomes are close to a coin toss (54% positive at one day, 75% at one year), while 96% of five-year and 100% of seven-year-plus windows in this 30-year record were positive. Time converts volatility into returns only for capital that can afford to wait.
Every period of stress produces a flood of confident commentary: bottom calls, index targets, forwarded ‘multibagger’ tips, comparisons with a neighbour’s returns. Most of it is noise. A short list is signal.
| Noise: do not manage your portfolio on this | Signal: watch these |
| Daily FII buy/sell prints | Brent against ~$95 (relief) and its highs (alarm) |
| Calls on the exact market bottom or index target | US 10-year yield direction and the rupee against 99.8 |
| Forwarded tips and last year’s small-cap winners | Whether mutual-fund flows into small and mid caps hold or turn to redemptions |
| Single-day headline reversals on oil or tariffs | Q2 and Q3 earnings delivery, margins and funding costs |
| What a friend’s portfolio returned | Drift of your own portfolio from its written bands |
The bull market will return, though no one knows when. Sir John Templeton’s old observation that bull markets are born in pessimism. Pessimism is certainly on offer today.
Our answer
Is the correction done? In price terms for large caps, largely. In time, earnings and macro terms, not yet, and nobody can tell you when it will be.
Is it time to invest? For long-horizon capital, in large-cap and diversified equity, in stages and with a written plan: yes. For the rest of the portfolio, the better question is not ‘when?’ but ‘how much, and in what?’
The patient investor’s edge is not predicting the bottom. It is owning a portfolio that does not require one.
Sources and notes. Entrust Family Office, Market Update (published 9 Oct 2026); Nippon India Mutual Fund, Equity Market Outlook (Oct 2026); Edelweiss Mutual Fund, TEMPO (Oct 2026; data to 30 Sep 2026); Dovetail, Capital Markets Unriddled (Sep 2026); R. Venkataraman, IIFL Group, newspaper commentary. Where sources differ (for example FII flow definitions, or September DII buying of roughly $6–8 billion depending on the source), we have used the more primary or more recent figure and flagged the difference. Third-party figures have not been independently verified.
Disclaimer. This note is for informational purposes only and is not investment advice, an offer or a solicitation. Investments in securities markets are subject to market risks; read all related documents carefully. Past performance is not indicative of future results, and illustrative frameworks are not recommendations. Suitability depends on each investor’s objectives, horizon, liquidity needs and tax position. Please consult your advisor before acting.
A 6.1% fall in the Nifty 50 in a single month is the sort of number that sharpens every family-office conversation. IT stocks fell 11%. Foreign investors sold $4.1 billion of Indian equities. Within days the RBI had raised rates, Brent had crossed $100 again, and the rupee was hovering near 96 to the dollar. […]
Reflections on the Custodians of Change Report A family may transfer ownership through a will, a trust or a shareholding. But the responsibility that comes with ownership takes years to develop. Ownership asks: “What belongs to me?” It brings rights, choices and the authority to make decisions. Entitlement assumes: “What should I receive because I […]
A Sunday of legacies, and what two great musical families taught me about the wealth that lasts Some days stay with you. Last Sunday was one of them. I had the privilege of being Chief Guest at Kanchanotsava 2026 in the morning, and Guest of Honour at the birth centenary celebration of Sangeeta Kalaratna Prof. […]
signup for updates